latex forum TexLive install (zenwalk) TeX Live guide summary of commands general guide general guide latex basics latex basics formatting formatting tips font info more font equations graphing information graphing instructions photos/graphics complex graphs tables lines, boxes templates: letters, tables BibTeX BibTeX Hongzhi's Notes convert latex to png
Note: If Perl or Tk version problems appear running tlmgr or tlmgr -gui, it might be searching on the DVD instead of the HDD installation. The way to confirm this is to run $ tlmgr update --list which will attempt to evaluate what packages could be updated by examining the database. If it comes back unable to find the database and the folder is the DVD, not the HDD, update where it looks:
$ tlmgr option location http://mirror.ctan.org/systems/texlive/tlnetAlso update tlmgr, before checking anything else.
$ tlmgr update --self
Latex
Unlike MS Word, LaTeX is not WYSIWYG, but we it's features are transparent,non-proprietary, and configurable to very fine grain. LaTeX seems slightly ungainly initially, before one understands what set of binaries they will typically use. One becomes more efficient as they learn, but the easiest approach for a noob appears to be to download a complete 2.8 GB TexLive or MiKTeX iso, that has all potential binaries and many templates. Just burn it to DVD and then install it to the hard-drive from the DVD. One will avoid encountering missing binary requirements by having a complete installation. The greatest advantage of the basic LaTeX being in ASCII text is that it is easily searchable w/grep, unlike proprietary formats (eg. Word). Additionally, publishers often produce .cls files which automatically, or nearly automatically, format one's text for the style of the journal's submission requirements. After placing in the appropriate directory, one only need change one line at the top of their document eg: \documentclass{theircls}.tex files
The basic LaTeX file is the ascii .tex file. It can be edited with any text editor. Once complete, the source .tex is compiled into a .dvi file (device independent), but it can also be compiled into other formats, such as .pdf, .ps, .ep, etc.
tex file syntax
The default settings for margins are huge, around 2" in every direction. In the basic .tex file below, I added {geometry} package information to overcome this but, if the default geometry is desired, {geometry} can be deleted. One can create their own style sheets and call them with \usepackage, applying desired behavior across any document, similar to the way a css sheet does in an html document.
test.tex
% percents are comments
\documentclass[letterpaper]{article}
\usepackage[left=3cm,top=3cm,right=3cm,nohead,nofoot]{geometry}
\usepackage[british]{babel}
% \usepackage[T1]{fontenc} accents, umlauts, etc
% \usepackage[utf8]{inputenc} chinese characters
% \usepackage{graphicx} if photos
% \usepackage{indentfirst} indents first para in section
% \usepackage[scaled]{helvet} sans serif pt1
% \renewcommand*\familydefault{\sfdefault} sans serif pt2
\author{\LaTeX Newbie}
\title{A Quick Example}
\begin{document}
\section{Notes Wk 1}
Math 674 -- Spring 2010
\subsection{20100116 Introduction}
We review the syllabus and introductions. A primary concern seems to be the use of a calculator.\\
Here are a couple of equations that are pretty well known, the second being the quadractic formula. I'm uncertain how to make a larger space between the two equations:
\begin{displaymath}
E = mc^2
\begin{array}{*{20}c} {x = \frac{{ - b \pm \sqrt {b^2 - 4ac} }}{{2a}}} &
{{\rm{when}}} & {ax^2 + bx + c = 0} \\ \end{array}
\end{displaymath}
\noindent
Just a short follow-up text
\end{document}
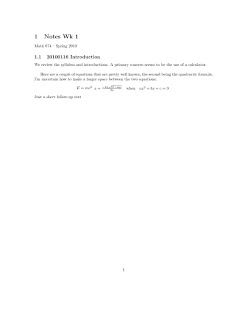
If we then compiled it into a .pdf with the command, say $ pdflatex test.tex , it looks like this:

graphs and photos
Many people creates graphs or plots of equations outside LaTeX and "\include" the results, while also using a package to process it. The main packages are eepic, graphicx, and tikz. Eepic is not known to work with pdflatex, which I use to compile my docs into PDF files. It appears a simple way is to use gnuplot from the command line, and export the resulting graph as an *.eps file. In the main document, use the graphicx package ("\usepackage {graphicx}") and then, where graphics are desired, call the eps file(s) using \includegraphics with the file name to insert the graphic. Graphicx can also import jpgs pngs and the like, as described in this wiki primer.
Another option is tikz, which is actual vector graphics. The package is \usepackage{tikz}, and then the callout is \begin{figure}, which is apparently the graphics area. Nested, we use \begin{tikzpicture} with associated code then entered to create the graph. Tikz apparently is a user application layer for a program called "pgf". The info on pgf along with some typical tikz examples is available at the pgf site. Chapter 12 of the TIKZ manual there is particularly helpful for mathematics graphing, but does not manage equations and smooth curves easily. It is possible, and looks clean, as seen here.
currency symbols inside math mode
Since dollar signs are a special operator used to delimit math mode, suppose we need actual dollar signs to display in a math output? Unfortunately, the only answer I've found to date is to insert: \text{\$}
tex to html, open office, word
Link: Geico Caveman's attempt
In TexLive, tex4ht appears worthless. For straight html, I didn't find anything better than $ htlatex foo.tex . this created an html document and associated css stylesheet that properly rendered math and text. At least in Firefox. The css stylesheet was bulky for a css and a few features will not parse, notably dfrac.
combining multiple documents
I can't write it any better than this excellent post for combining multiple .tex files into a book or other larger document.
